Dental Care Patient Satisfaction Benchmark Report
While More Patients Rated Their Experience Higher, Positive Ratings Saw a Decrease of 6.6% in July-December’18 as Compared to January-June’18, Which, if Not Addressed, Could Be an Early Indicator of Future Decline in Overall Satisfaction.
Key Takeaways
- 85.9% of patients gave positive ratings about their visit to dentists in July-December’18, whereas it was 82.4% in January-June’18.
- 1.6% rated their experience neutral in July-December’18, a decrease of 4.3% as compared to January-June’18.
- 12.5% rated their experience negative in July-December’18, which increased by 0.7% as compared to January-June’18.
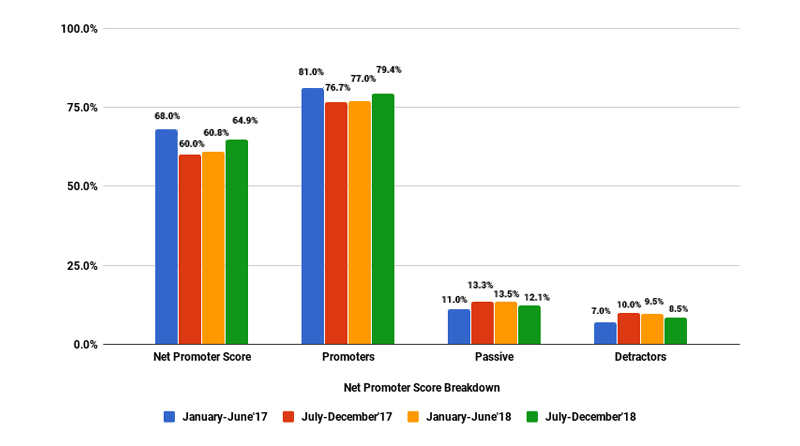
- Overall, the Net Promoter Score (a measure of patient’s loyalty) for dentists in July-December’18 is 64.9/100 (Total Sample = 414), whereas it was 60.8/100 in January-June’18.
-
- 79.4% of the patients are Promoters (patients who are likely to refer a specific dentist to a friend or family member), which increased by 2.4% when compared to January-June’18.
- 12.1% of the patients are Passives (patients who are likely not to take any action in referring a specific dentist), whereas it was 13.5% in January-June’18.
- 8.5% of the patients are Detractors (patients who are likely to deter people from choosing a specific dentist), a slight decrease of 1% when compared to January-June’18.
- Friendly, Love, and Experience were the dominant words used by patients who rated their experience as positive.
Welcome to the GMR Web Team Dental Patient Satisfaction Survey (July-December 2018)
Since the inception of our first patient satisfaction survey report (January-June 2017), we have seen some changes in the ways patients review their dental visit experience, but mostly in how we analyze it. This survey follows on from our first report, comparing the useful insights on reviews and patient satisfaction. The data was taken from our proprietary software RepuGen.
This survey measures the LOYALTY of patients for their dental offices and helps dentists understand the needs of their patients for developing effective patient-related programs to address their pain points. This will help in developing a stronger bond between the patient and the dentist, and the patients will become the advocate of the dental office, resulting in more referrals and fueling growth.
How Do Patients Rate Their Visit to Dental Office Based on Their RepuScore*?
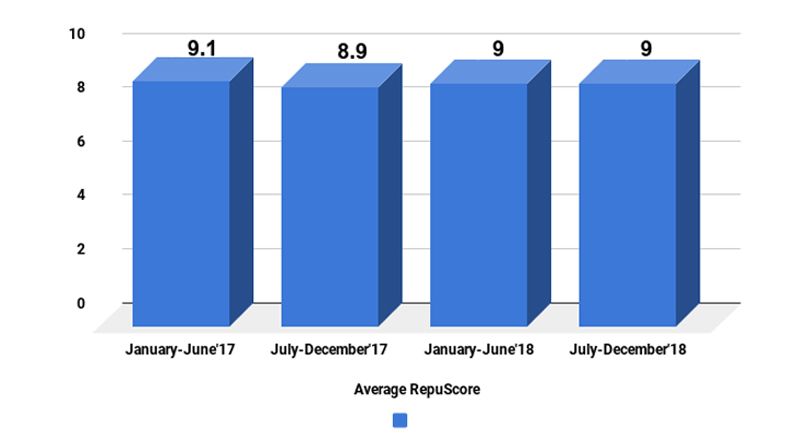
*Repuscore is the score given by patient on a scale of 0 to 10 when asked their likelihood of recommending the dentist based on their experience of the last visit. 0 means will not recommend and 10 means will recommend.
Key Findings
- The Average RepuScore in July-December 2018 remains the same 9 as it was in January-June 2018.
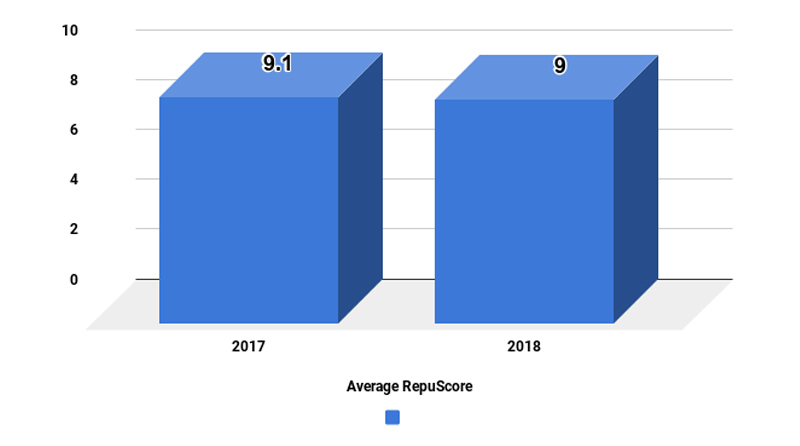
- The Average RepuScore throughout 2018 was 9, whereas it was 9.1 in 2017.
Analysis
- Given that the dental care centers in this study were using GMR Web Team tools to address patient complaints, it is not surprising that the likelihood of recommending the dentists remained almost the same.
- This also validates our view that paying more attention to patient experience at dental offices is the key to getting more recommendations from patients.
All Ratings (Rating Breakdown)
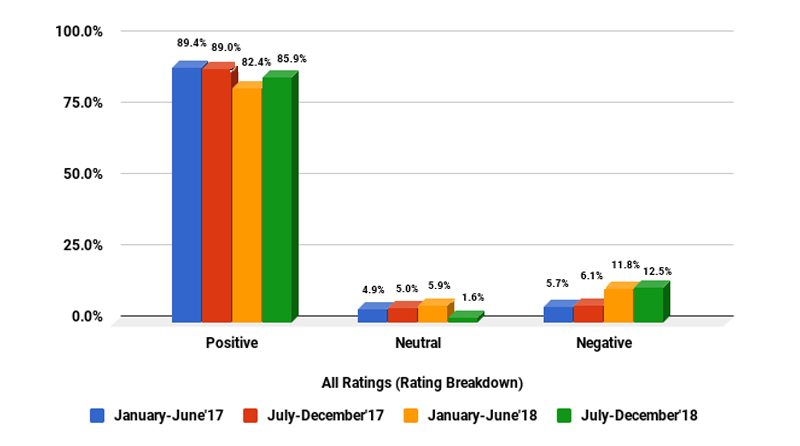
Key Findings
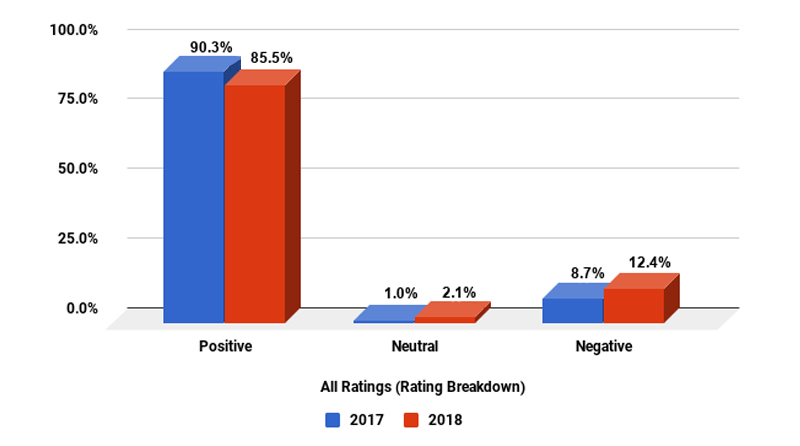
- More patients rated their experience as positive – 85.9% which increased by 3.5% when compared to January-June’18, whereas it decreased by 4.8% when we take the overall data of 2018 and compare it with the overall data of 2017.
- Patients rating their experience neutral decreased by 4.3% in July- December’18 when compared to the last survey (January-June’18), whereas it increased by 1.1% when we take the overall data for 2018 and 2017.
- 12.5% of patients in July- December’18 rated their experience negative, whereas it was 11.8% in January-June’18. However, when we take the overall data for 2017 and 2018, it was 8.7% and 12.4% respectively.
Analysis
- The increase in positive ratings and decrease in neutral ratings in July- December’18 suggest that the efforts by dental offices to address their patients’ concerns are helping to improve the patient experience. However, a decrease in 2018 as compared to 2017 is an area of concern for dental offices.
- A slight increase in negative ratings shows that most of the patients are not happy enough to rate their experience positive.
- Dental offices must compare their individual scores with the overall numbers to identify areas for improving the patient experience when they visit the office.
Net Promoter Score Breakdown
**The Net Promoter Score is an index ranging from -100 to 100 that measures the willingness of customers to recommend a company's products or services to others. It is used as a proxy for gauging the customer's overall satisfaction with a company's product or service and the customer's loyalty to the brand.
Key Findings
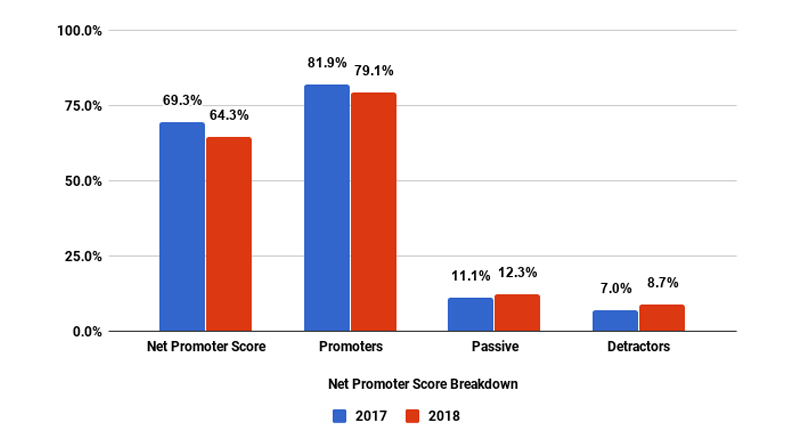
- Net Promoter Score saw an increase of 4.1% in July-December’18 when compared with the first six months of 2018, whereas it decreased by 5% when we take the overall data of 2018 and compare it with 2017 data.
- Percentage of patients who could become promoters decreased by 1.4% in July-December’18 as compared to January-June’18 and increased by 1.2% when we take the overall data of 2018 and compare it with 2017 data.
- 8.5% of current patients are likely to defer people from choosing their dentist, 1%-point decrease from the last survey. However, when we take the overall data for 2018, 8.7% of patients are not likely to recommend their dentist as compared to 7% in 2017.
Analysis
- The decrease in Net Promoter Score in 2018 suggests a drop in the potential for dentists to build upon patient referrals.
- Medical practices or dentists need to look at their individual scores and compare with the average number to identify areas where they are doing better and areas where they need to improve.
Patient Sentiment Analysis *** after their visit:
*** Patients are asked to explain their reason for rating their visit the way that they did. GMR Web Team analyzes sentiments and its intensity based on the comments, using an artificial intelligence tool. This gives a better perspective on satisfaction, as a rating of 10 could still be a so-so experience from a patient.
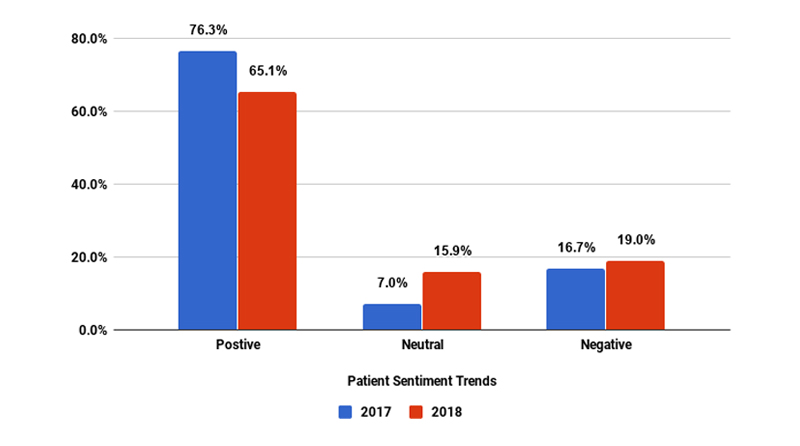
Patient Sentiment Trends
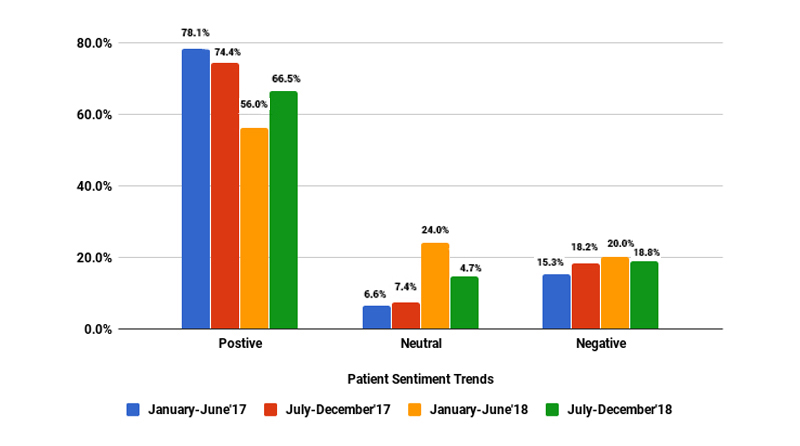
Key Findings
- Positive sentiment increased by 10.5% in July-December’18 as compared to January-June’18. However, it decreased by 11.2% in 2018 when we take the overall data of 2018 and compare it with 2017 (overall data).
- There was a decrease of 9.3% in neutral sentiment in July-December’18 as compared to January-June’18. However, it increased by 8.9% in 2018 (overall data) as compared to 2017 (overall data).
- Negative sentiment saw a decline of 1.2% in July-December’18 as compared to January-June’18. However, it increased by 2.3% in 2018 (overall data) as compared to 2017 (overall data).
Analysis
- An increase in positive sentiment and a decrease in negative and neutral sentiment in July-December’18 is a positive sign for dentists. However, a decrease in positive sentiment and an increase in negative and neutral sentiment in 2018 as compared to 2017 is an area of concern for dentists.
-
- Dentists and medical practices need to identify patients who showed positive and neutral sentiment and address them personally as soon as possible.
- There is room for improvement in patient recovery; dentists should handle unhappy patients proactively.
- Ratings are generally a less accurate way to measure a comment, as the most common ratings are a 10 or 0 – yet most people who rate this high or low are not this happy or dissatisfied.
- You need to measure the context of their comments, which is what this AI sentiment analysis tool does – at about a 3% margin of error.
- This also shows the online review scores aren’t always an accurate portrayal of reputation, based on how much the ratings are skewed.
- Note that a negative sentiment doesn’t equal an unhappy patient. Taking a comment as a whole, an AI sentiment analysis tool could take a positive rating as negative for something as simple as ‘the wait time was too long.’
Word Cloud Analysis****
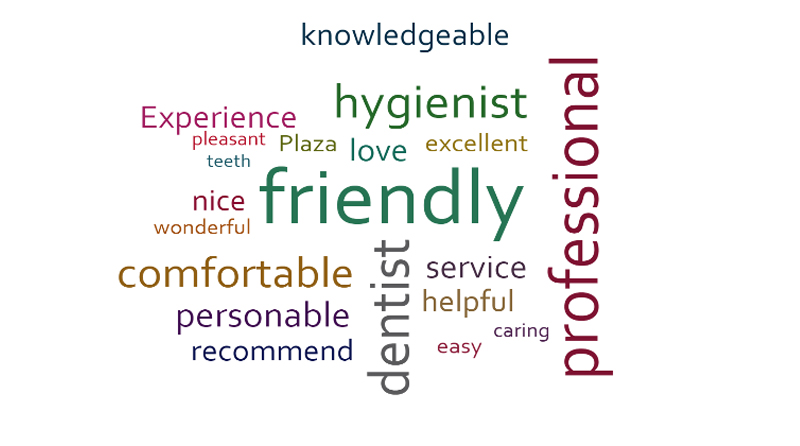
**** Word cloud analysis uses the frequency of words used by patients and picks up the most used words. Size of the word denotes frequency in the chart.
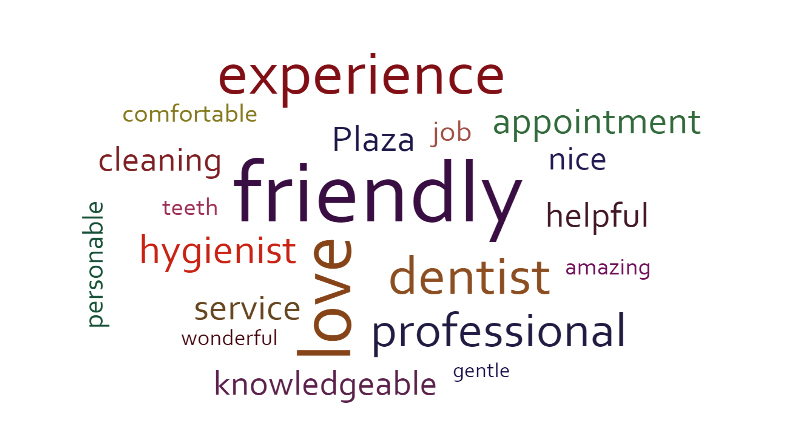
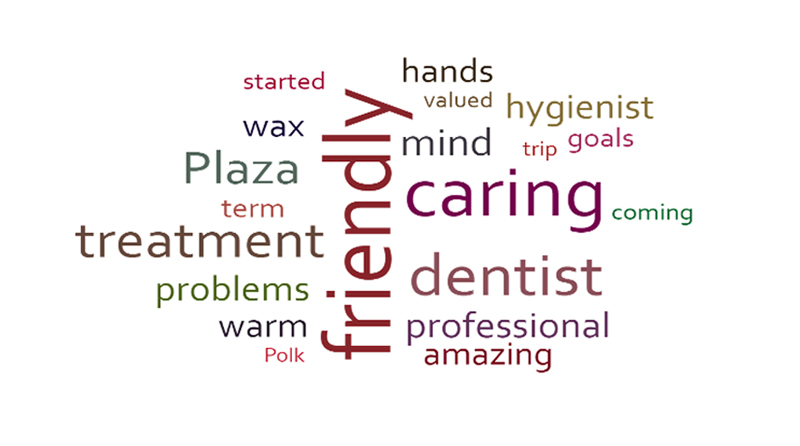
Positive Ratings -- Top 20
July-December’18
January-June’18
January-December’17
Key Findings
- Friendly, Love, Experience, and Professional were the most used words among patients who rated their visit between 9 and 10.
- Knowledgeable and Helpful were some other frequently used words.
Analysis
- Frequently used words by satisfied patients should resonate a positive sentiment, and thus could be used to build expectations for new patients, knowing fully well that it will resonate and that the practice will be able to fulfill the promise.
- An example could be making a bold statement like Friendly, Professional, Knowledgeable – these are the most used words that patients use to describe their visit.
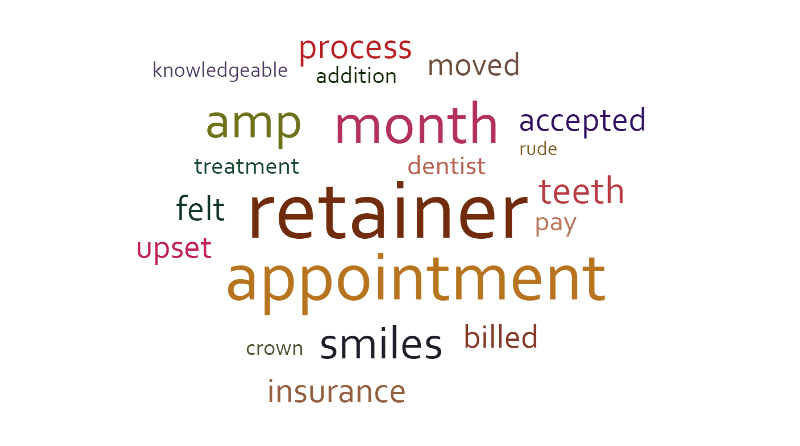
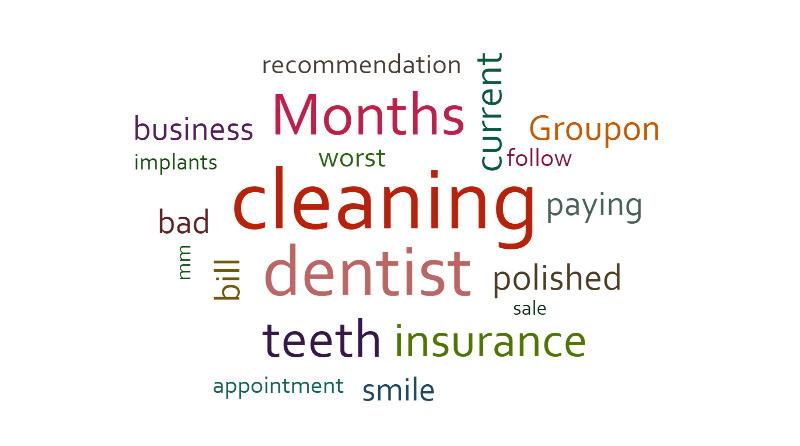
Negative Ratings -- Top 20
July-December’18
January-June’18

January-December’17
Key Findings
- Retainer, Cleaning, and Dollars are the most frequently used words by unhappy patients.
- Appointment, Month, Upset, Expensive, and Insurance are other negative words used by patients.
Analysis
- Frequently used words by unhappy patients allow the dentists to gauge patients’ reasons for dissatisfaction.
- However, given the fact that the comments of patients were detached, we can assume that Retainer and Appointment were among the major concerns. These words are more relevant when linked to the patients (which GMR Web Team account holders can do), and also when analyzing the complete review written by the patients.
About the GMR Web Team Dental Patient Satisfaction Survey
- An online survey was conducted from July 2018 through December 2018 among 414 patients, belonging to a handful of dentists in the U.S. who are using the GMR Web Team service. We then compared the findings with the first six months of 2018. We included the data of the first six months of 2017 and the last six months of 2017 to show the actual trends over the years. Also, we showed the annual trend by comparing the overall data of 2017 and 2018.
- The patients were asked to select their likelihood of recommending the dentist based on their latest experience on a scale of 0 to 10.
- Patients were asked to explain the reason behind their rating.
- All the information (rating score and comments) was detached from patient and doctor identification to make the report HIPAA* compliant. GMR Web Team cannot backtrack comments or sentiments to link Net Promoter Score or sentiments to patients or dentists who were used for this report.
*HIPAA - The Health Insurance Portability and Accountability Act, a US law designed to provide privacy standards to protect patients' medical records and other health information provided to health plans, doctors, hospitals and other health care providers.
- Patients were then classified into 3 categories – Promoters, Passives, and Detractors.
-
- Promoters: Patients giving a rating of either 9 or 10 to their dentists were classified as Promoters. They are loyal enthusiasts who will keep referring the dentists to other patients.
- Passives: Patients giving a rating of 7 or 8 to their dentists were classified as Passive. They are satisfied but NOT enthusiastic patients who are vulnerable to competitive offerings.
- Detractors - Patients giving a rating of 0 to 6 to their dentist were classified as Detractors. They are unhappy patients who can damage the reputation of their dentist and impede growth through negative word of mouth.
- All comments were grouped by positive, negative, and neutral ratings.
- An established 3rd party artificial intelligence tool RepuGen was used to gauge patient sentiment by group (positive, negative, neutral) and also to gauge the intensity of the sentiment based on their comments about their experience.
- GMR Web Team proprietary software RepuGen was used to analyze word density of comments by group for all patients to identify words used by patients to describe their experience.
Why Is the Dental Patient Satisfaction Benchmark Report So Important?
Online reviews and recommendations from existing patients are the best sources of new patients for dentists.
- In-depth analyses of patient experience help dentists identify their strengths and weaknesses, giving them the knowledge to make positive organizational changes.
- Understanding the patient sentiment and its intensity provides insight into the patients’ mindsets after they leave the office. Dentists can use the information to improve satisfaction and brand their practice consistent with the positive sentiments generated by their service.
- The density of words extracted from patients’ comments of different groups will help communicate the desired branding effort better.
Suggested Next Steps:
Dentists should gather patient experience information to better understand the patient sentiment, and ultimately improve patient care and satisfaction.
Patient satisfaction data can also be used to attract more patients by:
- Improving online reputation by requesting happy patients to share their information on the internet. Over 30% of prospective patients select their doctor solely based on their online reviews.
- Developing an automated referral program that requests happy patients to recommend their dentists to others.
Contact us at www.gmrwebteam.com to learn how you can start building your patient satisfaction data and how to use it to generate more patients.