Primary Care Patient Satisfaction Benchmark Report
Welcome to the First Research Findings of the Bi-Annual GMR Web Team Primary Care Patient Satisfaction Survey 2017 (January-June)
This survey measures the LOYALTY of patients for their primary care physicians and helps physicians understand the needs of their patients, in order to develop effective patient-related programs to address their pain points. This will help in developing a stronger bond between patients and physicians and allowing patients to become the advocate of their physicians, resulting in more referrals and fueling growth.
Key Takeaways from Primary Care Patient Survey:
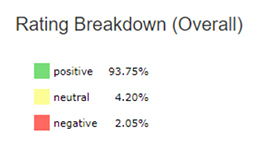
- 94% of patients gave positive ratings about their visit to primary care physicians
- 2% of patients rated their experience negative, whereas 4% rated their experience neutral.
- Overall, the Net Referral Score, a measure of patient’s loyalty, for Physicians is 85.6%*(Total Sample = 21,911)
-
- 85.6 % of the Patients are Promoters - Loyal enthusiasts who will keep referring other patients
- 9.4% of the patients are Passives - Satisfied but NOT enthusiastic patients who are vulnerable to competitive offerings
- 2.5% of the Patients are Detractors - Unhappy patients who can damage the reputation of Physicians and impede growth through negative word of mouth
Caring, Friendly, Listens, Professional and Knowledgeable were the dominant words used by patients who rated their experience as positive.
Appointment, Recommend, and Talk were the dominant words used by patients rating their experience as negative.
Net Promoter Score* -- 85.6%
Net Referral Score (a measure of Patient’s Loyalty) = % of Promoters - % of Detractors. Promoters are defined as % of patients who gave a rating of 9 or 10 to their Physician and Detractors are defined as % of patients who gave a rating between 0 and 6
Why the Primary Care Patient Satisfaction Benchmark Report?
Based on our experience of helping over 250 physicians since the inception of RepuGen in late 2016, we have noticed a fairly consistent Net Promoter Score of patients for their doctors. However, there is a lack of correlation between Net Promoter Score and physicians’ online reviews. This could be because unhappy patients are more likely to vent their frustrations online vs. satisfied patients posting about a positive experience online
There are four primary goals of this report:
- Develop a benchmark of patient’s loyalty for the entire Primary Care Physician category.
- Help individual physicians and medical groups track their Net Promoter Score vs. the entire category
- Identify patients’ pain points, develop programs to address these pain points, and track how these initiatives are impacting those pain points.
- Check online review scores to make sure it’s consistent with the average of the physicians used for this survey.
About the RepuGen Primary Care Patient Satisfaction Survey
- An online survey was conducted from January 2017 through June 2017 among 21,911 patients, belonging to over two dozen primary care physicians in Southern California who are using the RepuGen service.
- The patients were asked to select their likelihood of recommending the physician based on their latest experience on a scale of 0 to 10.
- Patients were asked to explain the reason behind their rating.
- All the information (rating score and comments) was detached from patient and doctor identification to make the report HIPAA compliant. RepuGen cannot backtrack comments or sentiments to link net promoter score or sentiment to any patient or physician.
- Patients were then classified into 3 categories – Promoters, Passives, and Detractors
-
- Promoters: Patients giving a rating of either 9 or 10 to their Physicians were classified as Promoters. They are loyal enthusiasts who will keep referring the physicians to other patients.
- Passives: - Patients giving a rating of 7 or 8 to their physician were classified as Passive. They are satisfied but NOT enthusiastic patients who are vulnerable to competitive offerings.
- All comments were grouped by positive, negative, and neutral ratings.
- An established 3rd party artificial intelligence tool was used to gauge patient sentiment by group (positive, negative, neutral) and also to gauge the intensity of the sentiment.
- RepuGen proprietary software was used to analyze word density of comments by group for all patients.
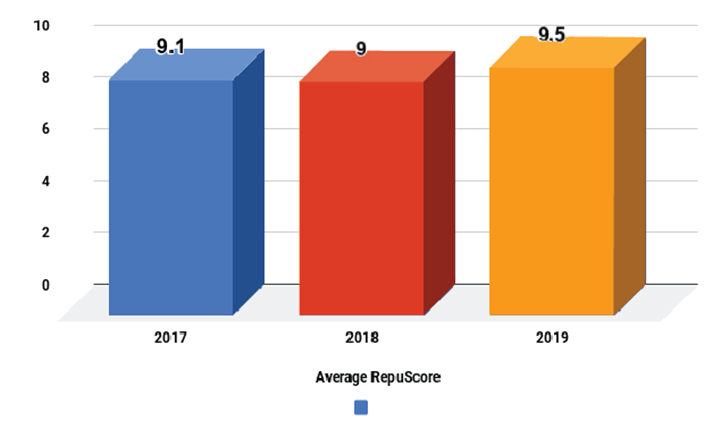
How Do Patients Rate Their Visit to Primary Care Physician Offices Based on Their RepuScore*?
*RepuScore is the score given by patients on a scale of 0 to 10 when asked their likelihood of recommending the physician or medical office based on their experience of the last visit. 0 means will not recommend and 10 means will recommend.
Net Promoter Score
Net Promoter Score* -- 85.6%
- Promoters – 92.8%
- Passive – 9%
- Detractors – 2%
The Net Promoter Score is an index ranging from -100 to 100 that measures the willingness of customers to recommend a company's products or services to others. It is used as a proxy for gauging the customer's overall satisfaction with a company's product or service and the customer's loyalty to the brand.
Key Findings:
- 93.75% of patients visiting primary care physicians walk away with high positive feelings.
- 92.8% of these patients can potentially be promoters for physicians if the appropriate process is used.
- 11% of current patients are either very unhappy or NOT very enthusiastic about their current Physicians and could leave them in the near future
Analysis:
- This key measurement of patient satisfaction suggests a very high level of satisfaction.
- However, up to 11% of their current patients are not promoters and could leave for another physician.
- A net promoter score of 85.6 suggests the possibility of an opportunity for physicians and medical practices to use a referral program to acquire new patients from their existing patient base.
Patient Sentiment Analysis after their visit:
All Ratings - 6 months
Patients are asked to explain their reason for rating their visit the way that they did. RepuGen analyzes sentiments based on the comments, using an artificial intelligence tool to understand their sentiments and the intensity of their sentiment.
Key Findings:
- 92% of patients left their physician with a feeling of contentment.
- Only 43% of those exhibiting “content” emotion, however showed high intensity. This suggests room for primary care physicians to improve their communication with patients and solidify their relationship with patients.
- Intensity of the majority of patients showing “trust” emotion was medium, thus leaving room for improvement on establishing trust between patients & primary care physicians.
- Similar to “trust”, patients’ “anger” emotion intensity was medium; suggesting room for patient recovery by handling unhappy patients proactively.
Analysis:
While 92% of the patients are “content” with their primary physician visit, the intensity of the emotion among the majority of patients is medium or low. Physicians and medical practices should consider instituting programs to increase patient satisfaction.
Given that 3/4th of “trust” emotion intensity is medium to low, physician and practices should work on building higher trust.
Word Cloud Analysis
Word cloud analysis uses the frequency of words used by patients and picks up the most used words. Size of the word denotes frequency in the chart above
Positive Ratings -- Top 20

Key Findings:
- Caring, Friendly, Listens and Professional were the most used words among patients who rated their visit between 9 and 10.
- Staff, Knowledgeable, and Nice were some other frequently used words.
Analysis:
Frequently used words by satisfied patients should resonate a positive sentiment, and thus could be used to build expectations for new patients, knowing fully well that it will resonate and that the practice will be able to fulfill the promise. An example could be making a bold statement like Listens, Caring, Friendly, Professional – these are the most used words that patients use to describe their visit.
Negative Ratings – Top 20
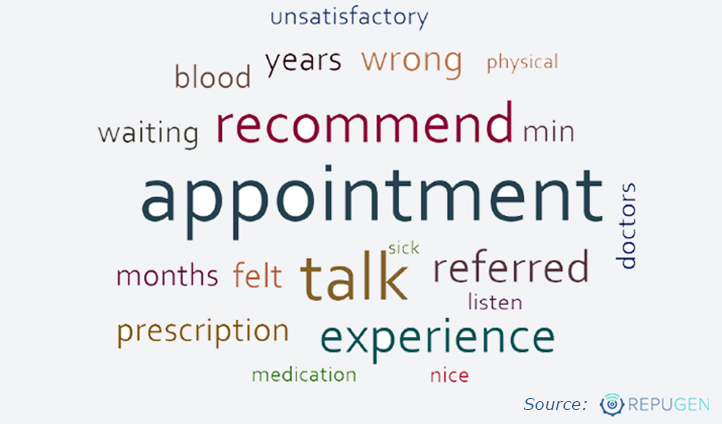
Key Findings:
- Wait is the most frequently word used by unhappy patients.
- Care, Hours, Prescribed, and Medication are other negative words used by patients.
Analysis:
Frequently used words by unhappy patients allow the urgent care centers to gauge patients’ reasons for dissatisfaction. However, given the fact that the comments of patients were detached, we can assume that the wait time and prescriptions were among the major concerns. These words are more relevant when linked to the patients (which RepuGen account holders can do), and also when analyzing the complete review written by the patients.
Why is the Primary Care Patient Satisfaction Benchmark Report so important?
Online reviews and recommendations from existing patients are the best source of new patients for urgent care centers. In-depth analyses of patient experience helps urgent care centers identify their strengths and weaknesses, giving them the knowledge to make positive organizational changes.
Understanding the patient sentiment and its intensity provides insight into the patients’ mindsets after they leave the office. Urgent care centers can use the information to improve satisfaction and brand their practice consistent with the positive sentiments generated by their service.
Density of words extracted from patient’s Net Promoter Score of different groups will help communicate the desired branding effort better.
Suggested Next Steps:
Urgent care centers should gather patient experience information to better understand patient sentiment, and ultimately improve patient care and satisfaction.
Patient satisfaction data can also be used to attract more patients by:
- Improving online reputation by requesting happy patients to share their information on the internet. Over 30% of prospective patients select their doctor solely based on their online reviews.
- Developing an automated referral program that requests happy patients to recommend their doctor or family medicine practice to others.
Contact us at www.gmrwebteam.com to learn how you can start building your patient satisfaction data and how to use it to generate more patients.