Primary Care Patient Satisfaction Benchmark Report

96% positive ratings from patients who made more than one visit to primary care physicians indicate a healthy patient satisfaction level.
Key Takeaways
- 96% of multiple-time visitors rated our primary care physicians positively, while 2% were neutral and the other 2% were unhappy with their services.
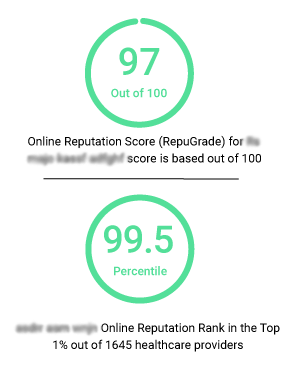
- Overall, 96.6% of patients gave positive ratings to primary care physicians, indicating a marginal decline of 0.2% from 96.8% in 2020.
- Overall, the Net Promoter Score (a measure of patient loyalty) for physicians is 90/100 (Total Sample = 285,722), whereas it was 90.60/100 in 2020.
-
- 92.2 % of the patients are Promoters (patients who are likely to refer a specific practice/doctor to a friend or family member), down by 0.4% compared to 2020.
- 5.6% of the patients are Passives (patients who are not likely to take any action in referring to a specific practice/doctor), whereas it was 5.5% in 2020.
- 2.2% of the patients are Detractors (patients who are likely to deter people from choosing a specific practice/doctor), an increase of 0.3% compared to 2020.
- Excellence (22.5%), Pleasant (15.6%), and Thorough (7.4%) were the dominant words used by patients who rated their experience as positive.
Welcome to the GMR Web Team Primary Care Patient Satisfaction Survey (2021)
Since the commencement of our first patient satisfaction survey report (January-June 2017), we have noticed some changes in how people rate their healthcare visit experience, but largely in how we analyze it. This survey is a follow-up to our initial study, which compared the relevant insights on reviews and patient satisfaction. The data came from our proprietary program RepuGen.
This survey assesses patients' emotions and views about their primary care physicians and assists physicians in understanding their patients' requirements to build effective patient-related initiatives to attract and retain more patients. This will aid in the development of a stronger link between patients and physicians, and patients will become advocates for their physicians, resulting in more referrals and fueling growth.
How Do Patients Rate Their Visit to Primary Care Center Office Based on Their RepuScore*?
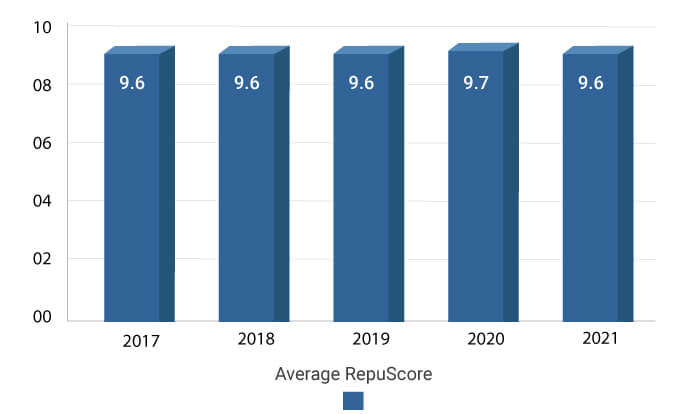
*RepuScore is the score given by patients on a scale of 0 to 10 when asked about their likelihood of recommending the physician based on their experience of the last visit. 0 means will not recommend, and 10 means will recommend.
Key Findings
- The Average RepuScore decreased to 9.6 in 2021 from 9.7 in 2020.
Analysis
- Given that we have surveyed a huge number of patients (285,7220) this time compared to last time (101,381), a marginal decline of 0.1 is on the expected lines. Overall, the 9.6 RepuScore rating matches our average rating for the last five years.
- This also reinforces our belief that focusing more on the patient experience is the key to obtaining more patient referrals.
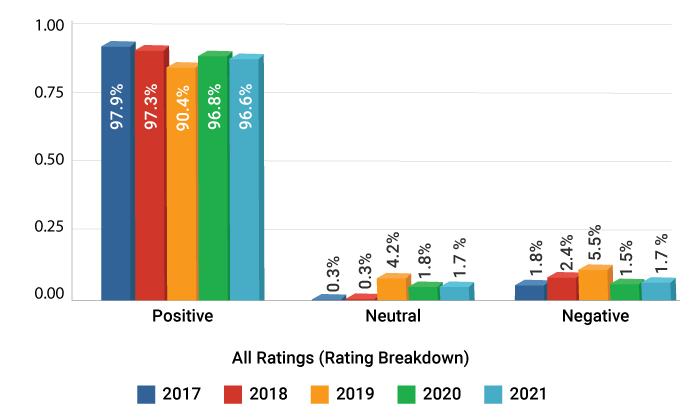
All Ratings (Rating Breakdown)
Key Findings
- Consistent with the overall data, a very large number of patients rated their experience as positive. The positive reviews marginally decreased by 0.2% in 2021 compared to 2020.
- Patients rating their experience neutral decreased by 0.1 %, whereas those rating as negative increased by 0.2 % in 2021 compared to 2020.
Analysis
- Such high positive ratings suggest that primary care physicians' attempts to address their patients' issues are helping to enhance the patient experience.
- There’s a marginal decline of 0.2% from last year, but the 96.6% rating is still above our 95.8% average for the last five years. We should also note that COVID-19 had a crucial role in massively increasing the positive ratings in 2020, but it was not the same case in 2021.
- The marginal decline could be attributed to the fact that:
- This year, we surveyed a record 285,7220 patients, almost three times as last year. So, more patients mean more diversified opinions from numerous backgrounds resulting in a slight decline in overall positive ratings.
- In 2020, due to the unknown nature of COVID-19, there was a lot of panic among people, so they were visiting primary care providers more often and were rating them much more frequently after getting relieved of any possible COVID symptoms. In 2021, with the situation getting better, the number of panic visits to primary care reduced. With less enthusiastic patients, the number of positive reviews was also reduced. Hence we can see a 0.2% marginal decline.
- To improve patient satisfaction, primary care providers should focus more on the patient’s experience.
- To find opportunities for enhancing the patient experience when they visit the clinic, primary care facilities must compare their individual ratings to the total figures.
Net Promoter Score Breakdown
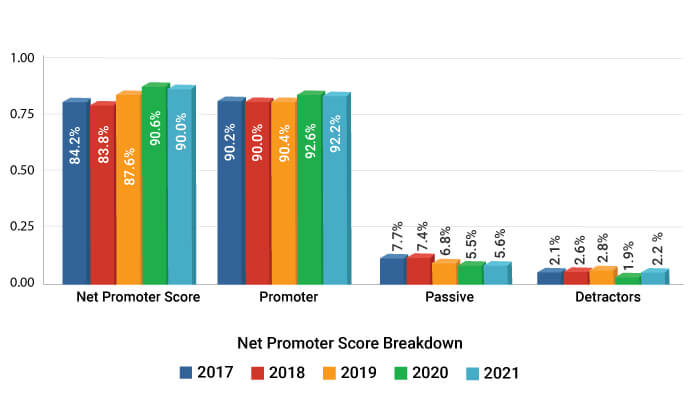
The Net Promoter Score is an index ranging from -100 to 100 that measures the willingness of customers to recommend a company's products or services to others. It is used as a proxy for gauging the customer's overall satisfaction with a company's product or service and the customer's loyalty to the brand.
Key Findings
- Net Promoter Score saw a decrease of 0.6% in 2021 compared to 2020.
- The percentage of patients who could become promoters decreased by 0.4% in 2021 compared to 2020.
- 2.2 % of patients were less likely to recommend their primary care center than 1.9% in 2020.
- 5.6% of people were not likely to take any action in relation to referring a primary care provider, 0.1% more than 2020.
Analysis
- The decrease in Net Promoter Score in 2021 suggests a slight decrease in patients' loyalty to their primary care center and how increasingly important patient referrals are becoming.
- Overall, 7.8% of patients are not likely to refer people to their primary care physician.
- Primary care centers need to look at their individual scores and compare them with the average number to identify areas where they are doing better and areas where they can improve.
Patient Sentiment Analysis *** after their visit:
***Patients are asked to describe why they rated their visit the way they did. Using an artificial intelligence technique, GMR Web Team assesses sentiments and their intensity based on entities and attributes. This provides a better understanding of whether the patient has a favorable or negative sentiment/opinion about their physician.
Patient Sentiment Trends
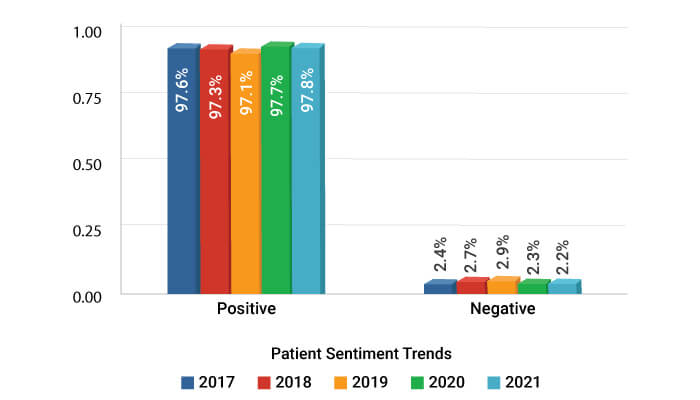
Key Findings
- Positive sentiment saw an increase of 0.1 % in 2021 compared to 2020.
- There was a decrease of 0.1% in negative sentiment in 2021 compared to the last report (2020).
Analysis:
- General Inference
-
- From the Patient’s POV:
Just like in 2020, patients are responsive and grateful for primary care services. This sense of gratitude might be triggering the increase in positive sentiment and the decline in negative ones. People have become more health-conscious, seeking treatment options early, enabling prompt resolution.
- From Primary Care Service Providers’ POV
To meet the challenges posed by COVID, they are offering more timely and effective services:
- Patients who expressed neutral or unfavorable opinions should be identified and addressed directly as soon as feasible by primary care facilities.
- This differs from RepuScore in that it uses artificial intelligence to scan actual patient remarks rather than simply their 0-10 rating.
- Ratings are a less accurate approach to gauge a statement in general since the most common ratings are a 10 or a 0 - although most individuals who rate this high or low are not this happy or unsatisfied.
- You must assess the context of their comments, which is what our AI sentiment analysis technology accomplishes — with a 3 percent margin of error.
- This also demonstrates that, depending on how slanted the evaluations are, online review scores aren't necessarily an accurate representation of reputation.
- It is important to note that a negative feeling does not imply a dissatisfied patient. An AI sentiment analysis program might interpret a good review as negative for anything as simple as 'the wait time was too lengthy.'
Patient Service Recovery
| Year |
Negative Response |
Completed |
Average Response Days |
| 2020 |
3172 |
2427 |
3 day(s) |
| 2021 |
4768 |
3029 |
4 day(s) |
*Our proprietary software not only notifies urgent care providers of their patients’ sentiments but also helps them identify unsatisfied patients and quickly resolve their concerns, thus allowing them to:
- maintain patient satisfaction level
- retain patients they were about to lose
Key Findings
We received 4768 negative responses in 2021, out of which we were able to resolve 3029 on an average of just four days. This means we converted 63.5% of dissatisfied patients into satisfied ones with our rapid response management.
Analysis:
- Patient service recovery is critical to the retention and expansion of any healthcare practice. Primary care facilities can develop an outstanding online reputation and acquire more referrals by expediting the recovery process and assuring timely resolution of patient issues.
- Tracking negative feedback, finding the fundamental cause, and responding quickly will increase patient loyalty, transforming them into promoters.
Entities and Attributes That Highlight Patients’ Sentiments
**** Our AI tool has analyzed the positive and negative entities based on the frequency of the words mentioned below (attributes) used in the comments made by patients.
Key Findings
Out of 65652 comments, 98.9% expressed a positive sentiment, while 1.1% expressed a negative sentiment.
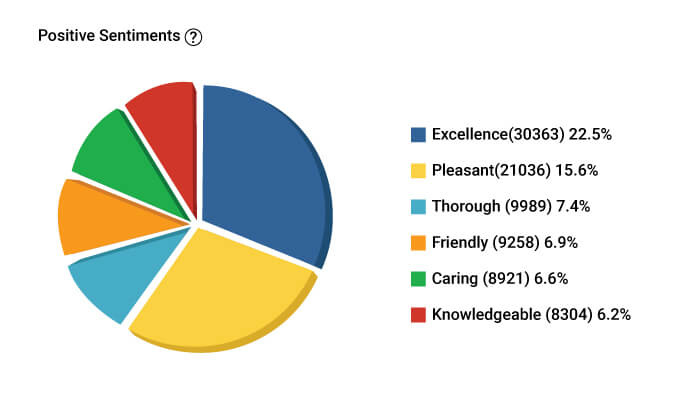
Excellence (22.5%), Pleasant (15.6%), and Thorough (7.4%) were the top 3 positive sentiments expressed by the patients.
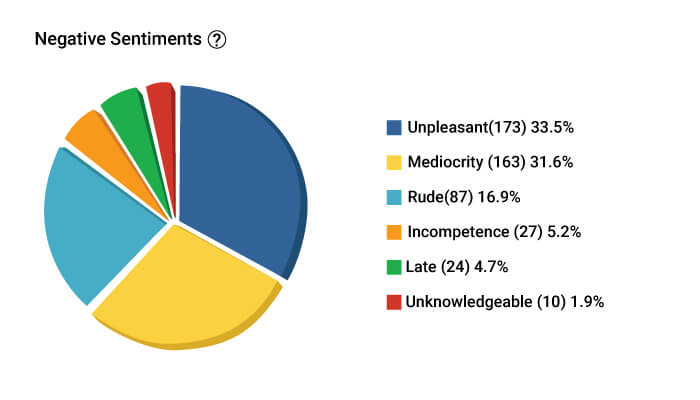
Unpleasant (33.5%), Late (31.6%), and Rude (16.9%) were the top 3 negative sentiments expressed by the patients.
Analysis:
- Other than the top 3 positive sentiments- friendly, caring, and knowledgeable were some of the other favorable characteristics mentioned by the patient. Primary care physicians must base their practices on these positive sentiments to establish and sustain higher levels of patient satisfaction.
- Other than the top 3 negative sentiments- incompetence, inefficient and unknowledgeable were some of the other terms patients used to express their disappointing experiences. The unfavorable feelings conveyed the need for the provider's attention, exposing areas that require quick correction before they escalate into a larger source of unhappiness among patients.
- It is important to note that a negative feeling does not imply a dissatisfied patient. An AI sentiment analysis program might interpret a good review as negative for anything as simple as 'the wait time was too lengthy.’
About the GMR Web Team Primary Care Patient Satisfaction Survey
- An online survey was conducted from January 2021 through December 2021 among 285,722 patients at primary care centers that are using the GMR Web Team service. We included the data for 2020, 2019, 2018, and 2017 to show the actual trends over the years.
- On a scale of 0 to 10, patients were asked to rate their likelihood of referring the doctor based on their most recent encounter.
- Patients were asked to explain the reason for their rating.
- To ensure HIPAA compliance, all information (rating score and comments) was separated from the patient and doctor identification. GMR Web Team cannot trace comments or sentiments back to any patient or physician utilized in this report to correlate Net Promoter Score or sentiment.
- HIPAA - The Health Insurance Portability and Accountability Act, a US law established to set privacy requirements to protect individuals' medical records and other health information submitted to health plans, doctors, hospitals, and other providers.
- Patients were then divided into three groups: promoters, passives, and detractors.
- Promoters: Patients who gave their doctors a rating of 9 or 10 were categorized as Promoters. They are loyal supporters who will continue to refer people to the doctors.
- Passives: Patients who gave their doctor a rating of 6 to 8 were classed as passive. They are contented but not ecstatic patients who are sensitive to competing offers.
- Detractors: Patients who gave their doctor a rating of 0 to 5 were classed as Detractors. They are dissatisfied patients who can harm their doctor's reputation and stifle growth through poor word of mouth.
- All comments were grouped into positive, negative, and neutral ratings.
- GMR Web Team proprietary software was used to assess patient sentiment by group (positive, negative, neutral) and strength of sentiment based on comments about their experience.
Why Is the Primary Care Patient Satisfaction Benchmark Report So Important?
The best source of new patients for primary care providers is online reviews and referrals from existing patients.
- In-depth patient experience studies assist physicians in identifying their strengths and limitations, allowing them to create positive organizational adjustments.
- Understanding the patients’ sentiment and intensity offers insight into their thinking after leaving the office. Physicians may utilize the data to increase patient satisfaction and brand their practice in line with the favorable impressions created by their service.
- The density of terms selected from distinct groups of patients' remarks will aid in communicating the desired branding effort more effectively.
Suggested Next Steps:
Primary care physicians and family medicine clinics should collect patient experience data to better understand the patient sentiment and, as a result, enhance patient treatment and satisfaction.
Patient satisfaction data may also be utilized to attract additional patients by doing the following:
- Improving online reputation by asking satisfied patients to share their experiences on the internet. Approximately 81% of potential patients utilize internet reviews as their initial step in locating new providers.
- Creating an automatic referral scheme in which satisfied patients are asked to recommend their doctor or family medical practice to others.
Contact us at 800-523-7187 or fill out our form to learn how you can start building your patient satisfaction data and how to use it to generate more patients.